版本:
n9e v6 G10
问题描述:
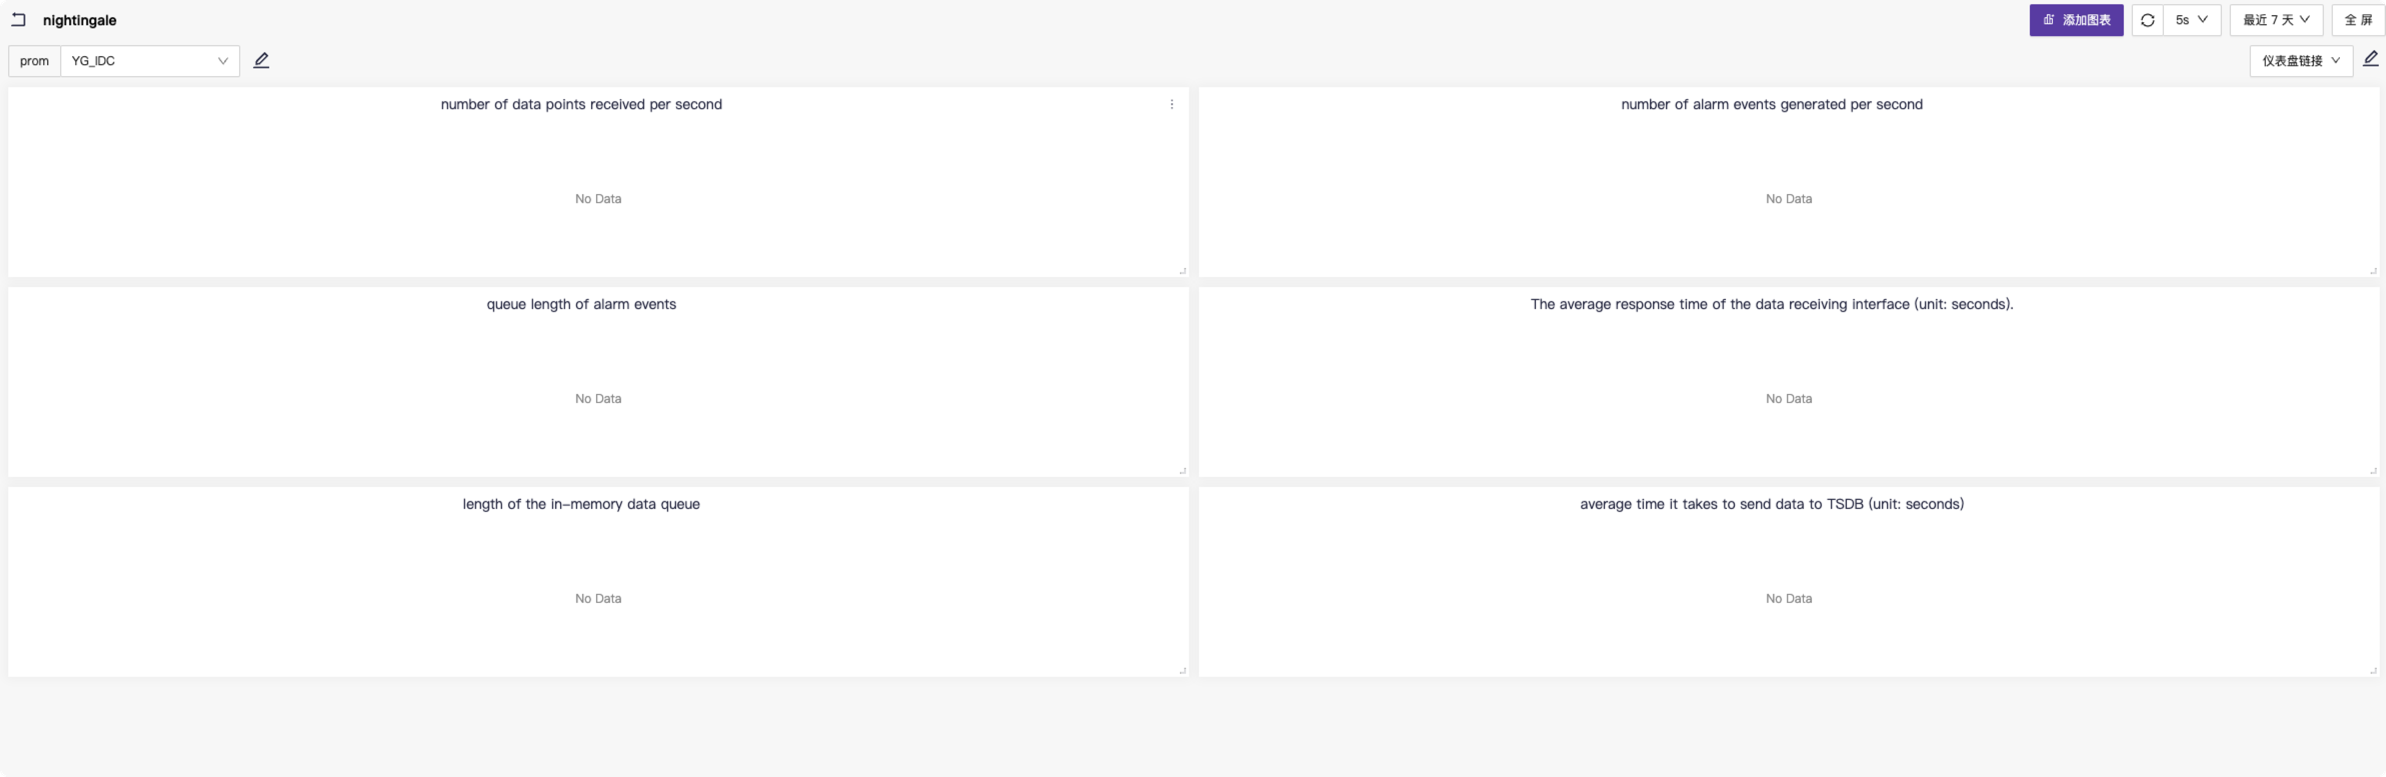
通过n9e部署完毕后默认的prometheus会监控n9e:17000/metrics , 这个连接是有相关数据出现,但是在控制台系统自带仪表盘查看n9e相关监控是没数据的,里面一些指标也是在metrics中没有。
下面是我的n9e自身指标信息:
# HELP go_gc_duration_seconds A summary of the pause duration of garbage collection cycles.
# TYPE go_gc_duration_seconds summary
go_gc_duration_seconds{quantile="0"} 9.9395e-05
go_gc_duration_seconds{quantile="0.25"} 0.000128525
go_gc_duration_seconds{quantile="0.5"} 0.000142051
go_gc_duration_seconds{quantile="0.75"} 0.000160286
go_gc_duration_seconds{quantile="1"} 0.006032639
go_gc_duration_seconds_sum 1.026084414
go_gc_duration_seconds_count 5599
# HELP go_goroutines Number of goroutines that currently exist.
# TYPE go_goroutines gauge
go_goroutines 275
# HELP go_info Information about the Go environment.
# TYPE go_info gauge
go_info{version="go1.18.10"} 1
# HELP go_memstats_alloc_bytes Number of bytes allocated and still in use.
# TYPE go_memstats_alloc_bytes gauge
go_memstats_alloc_bytes 9.2480664e+07
# HELP go_memstats_alloc_bytes_total Total number of bytes allocated, even if freed.
# TYPE go_memstats_alloc_bytes_total counter
go_memstats_alloc_bytes_total 2.34722869072e+11
# HELP go_memstats_buck_hash_sys_bytes Number of bytes used by the profiling bucket hash table.
# TYPE go_memstats_buck_hash_sys_bytes gauge
go_memstats_buck_hash_sys_bytes 2.659278e+06
# HELP go_memstats_frees_total Total number of frees.
# TYPE go_memstats_frees_total counter
go_memstats_frees_total 2.625224805e+09
# HELP go_memstats_gc_sys_bytes Number of bytes used for garbage collection system metadata.
# TYPE go_memstats_gc_sys_bytes gauge
go_memstats_gc_sys_bytes 9.179144e+06
# HELP go_memstats_heap_alloc_bytes Number of heap bytes allocated and still in use.
# TYPE go_memstats_heap_alloc_bytes gauge
go_memstats_heap_alloc_bytes 9.2480664e+07
# HELP go_memstats_heap_idle_bytes Number of heap bytes waiting to be used.
# TYPE go_memstats_heap_idle_bytes gauge
go_memstats_heap_idle_bytes 9.068544e+06
# HELP go_memstats_heap_inuse_bytes Number of heap bytes that are in use.
# TYPE go_memstats_heap_inuse_bytes gauge
go_memstats_heap_inuse_bytes 9.3233152e+07
# HELP go_memstats_heap_objects Number of allocated objects.
# TYPE go_memstats_heap_objects gauge
go_memstats_heap_objects 548553
# HELP go_memstats_heap_released_bytes Number of heap bytes released to OS.
# TYPE go_memstats_heap_released_bytes gauge
go_memstats_heap_released_bytes 6.06208e+06
# HELP go_memstats_heap_sys_bytes Number of heap bytes obtained from system.
# TYPE go_memstats_heap_sys_bytes gauge
go_memstats_heap_sys_bytes 1.02301696e+08
# HELP go_memstats_last_gc_time_seconds Number of seconds since 1970 of last garbage collection.
# TYPE go_memstats_last_gc_time_seconds gauge
go_memstats_last_gc_time_seconds 1.686810472894274e+09
# HELP go_memstats_lookups_total Total number of pointer lookups.
# TYPE go_memstats_lookups_total counter
go_memstats_lookups_total 0
# HELP go_memstats_mallocs_total Total number of mallocs.
# TYPE go_memstats_mallocs_total counter
go_memstats_mallocs_total 2.625773358e+09
# HELP go_memstats_mcache_inuse_bytes Number of bytes in use by mcache structures.
# TYPE go_memstats_mcache_inuse_bytes gauge
go_memstats_mcache_inuse_bytes 2400
# HELP go_memstats_mcache_sys_bytes Number of bytes used for mcache structures obtained from system.
# TYPE go_memstats_mcache_sys_bytes gauge
go_memstats_mcache_sys_bytes 15600
# HELP go_memstats_mspan_inuse_bytes Number of bytes in use by mspan structures.
# TYPE go_memstats_mspan_inuse_bytes gauge
go_memstats_mspan_inuse_bytes 634032
# HELP go_memstats_mspan_sys_bytes Number of bytes used for mspan structures obtained from system.
# TYPE go_memstats_mspan_sys_bytes gauge
go_memstats_mspan_sys_bytes 764784
# HELP go_memstats_next_gc_bytes Number of heap bytes when next garbage collection will take place.
# TYPE go_memstats_next_gc_bytes gauge
go_memstats_next_gc_bytes 9.5387248e+07
# HELP go_memstats_other_sys_bytes Number of bytes used for other system allocations.
# TYPE go_memstats_other_sys_bytes gauge
go_memstats_other_sys_bytes 836578
# HELP go_memstats_stack_inuse_bytes Number of bytes in use by the stack allocator.
# TYPE go_memstats_stack_inuse_bytes gauge
go_memstats_stack_inuse_bytes 2.555904e+06
# HELP go_memstats_stack_sys_bytes Number of bytes obtained from system for stack allocator.
# TYPE go_memstats_stack_sys_bytes gauge
go_memstats_stack_sys_bytes 2.555904e+06
# HELP go_memstats_sys_bytes Number of bytes obtained from system.
# TYPE go_memstats_sys_bytes gauge
go_memstats_sys_bytes 1.18312984e+08
# HELP go_threads Number of OS threads created.
# TYPE go_threads gauge
go_threads 12
# HELP n9e_alert_alert_queue_size The size of alert queue.
# TYPE n9e_alert_alert_queue_size gauge
n9e_alert_alert_queue_size 0
# HELP n9e_alert_alerts_total Total number alert events.
# TYPE n9e_alert_alerts_total counter
n9e_alert_alerts_total{cluster="1"} 56
n9e_alert_alerts_total{cluster="2"} 19
n9e_alert_alerts_total{cluster="3"} 22
# HELP n9e_cron_duration Cron method use duration, unit: ms.
# TYPE n9e_cron_duration gauge
n9e_cron_duration{name="sync_alert_mutes"} 0
n9e_cron_duration{name="sync_alert_rules"} 0
n9e_cron_duration{name="sync_alert_subscribes"} 0
n9e_cron_duration{name="sync_busi_groups"} 0
n9e_cron_duration{name="sync_datasources"} 0
n9e_cron_duration{name="sync_recording_rules"} 0
n9e_cron_duration{name="sync_targets"} 30
n9e_cron_duration{name="sync_user_groups"} 0
n9e_cron_duration{name="sync_users"} 0
# HELP n9e_cron_sync_number Cron sync number.
# TYPE n9e_cron_sync_number gauge
n9e_cron_sync_number{name="sync_alert_mutes"} 0
n9e_cron_sync_number{name="sync_alert_rules"} 0
n9e_cron_sync_number{name="sync_alert_subscribes"} 0
n9e_cron_sync_number{name="sync_busi_groups"} 0
n9e_cron_sync_number{name="sync_datasources"} 0
n9e_cron_sync_number{name="sync_recording_rules"} 0
n9e_cron_sync_number{name="sync_targets"} 49
n9e_cron_sync_number{name="sync_user_groups"} 0
n9e_cron_sync_number{name="sync_users"} 0
# HELP n9e_pushgw_samples_received_total Total number samples received.
# TYPE n9e_pushgw_samples_received_total counter
n9e_pushgw_samples_received_total{channel="prometheus"} 1.0070446e+08
# HELP process_cpu_seconds_total Total user and system CPU time spent in seconds.
# TYPE process_cpu_seconds_total counter
process_cpu_seconds_total 3896.83
# HELP process_max_fds Maximum number of open file descriptors.
# TYPE process_max_fds gauge
process_max_fds 65536
# HELP process_open_fds Number of open file descriptors.
# TYPE process_open_fds gauge
process_open_fds 85
# HELP process_resident_memory_bytes Resident memory size in bytes.
# TYPE process_resident_memory_bytes gauge
process_resident_memory_bytes 1.33005312e+08
# HELP process_start_time_seconds Start time of the process since unix epoch in seconds.
# TYPE process_start_time_seconds gauge
process_start_time_seconds 1.68662374758e+09
# HELP process_virtual_memory_bytes Virtual memory size in bytes.
# TYPE process_virtual_memory_bytes gauge
process_virtual_memory_bytes 8.30287872e+08
# HELP process_virtual_memory_max_bytes Maximum amount of virtual memory available in bytes.
# TYPE process_virtual_memory_max_bytes gauge
process_virtual_memory_max_bytes 1.8446744073709552e+19
# HELP promhttp_metric_handler_requests_in_flight Current number of scrapes being served.
# TYPE promhttp_metric_handler_requests_in_flight gauge
promhttp_metric_handler_requests_in_flight 1
# HELP promhttp_metric_handler_requests_total Total number of scrapes by HTTP status code.
# TYPE promhttp_metric_handler_requests_total counter
promhttp_metric_handler_requests_total{code="200"} 12451
promhttp_metric_handler_requests_total{code="500"} 0
promhttp_metric_handler_requests_total{code="503"} 0
如果有更新过仪表盘,求一份最新的。。