categraf prometheus插件频繁丢数据

Viewed 146
  • 背景信息:夜莺和categraf部署于k8s,metrics由夜莺接收后写入到 VictoriaMetrics 集群。该categraf只启用prometheus插件,专门做Prometheus接口的采集。
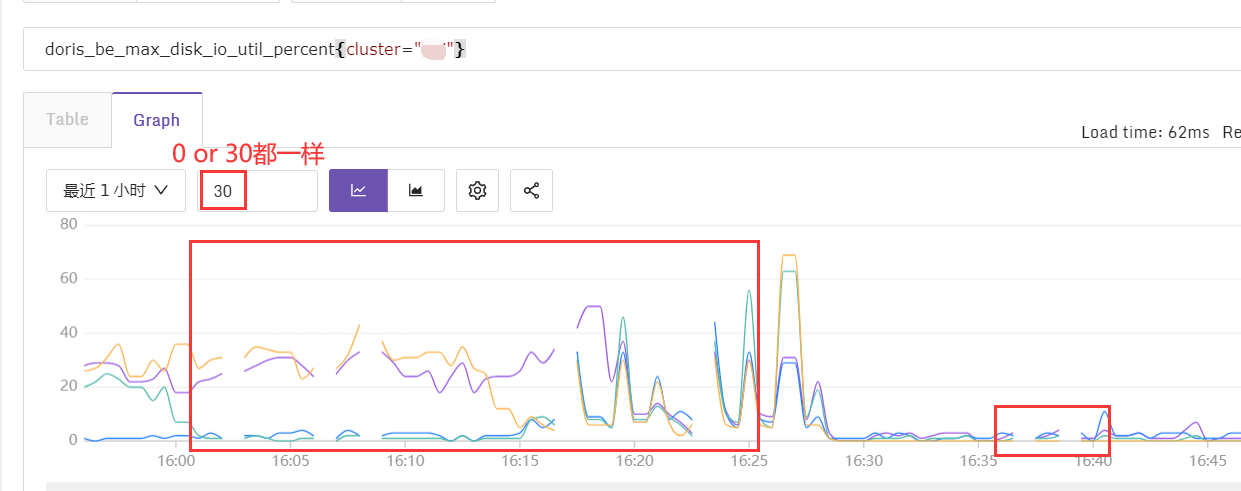
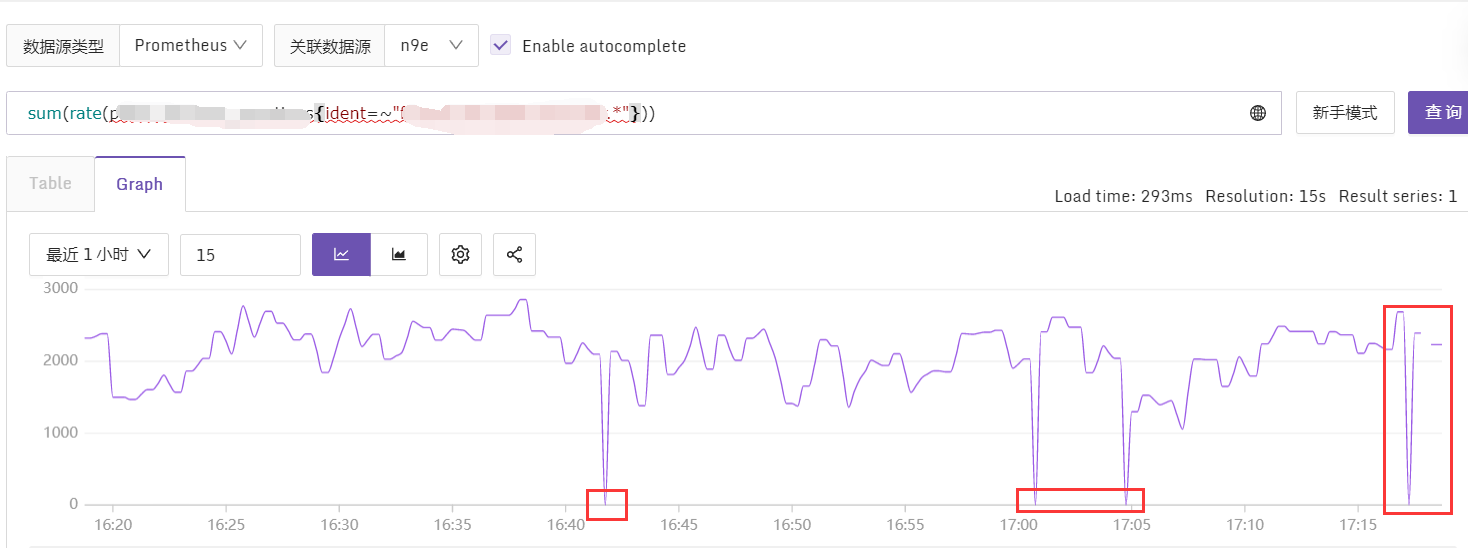
  • 问题:约50个地址,几乎每个地址都有丢数据的情况,见下图。categraf日志未见异常。

categraf 基础配置

    [global]
    print_configs = false
    hostname = ""
    omit_hostname = true
    precision = "ms"
    interval = 30

    [writer_opt]
    batch = 5000
    chan_size = 2000000

    [[writers]]
    url = "http://n9e-server:19000/prometheus/v1/write"
    # timeout settings, unit: ms
    timeout = 5000
    dial_timeout = 2500
    max_idle_conns_per_host = 1000

categraf inputs.prometheus 配置

    [[instances]]
    labels = { ident="master", cluster="aaa", role="master" }
    urls = [
        "http://machine1:19091/metrics",
        "http://machine2:19091/metrics",
        "http://machine3:19091/metrics",
        "http://machine4:19091/metrics",
        "http://machine5:19091/metrics"
    ]
    url_label_key = "instance"
    url_label_value = "{{.Host}}"
    headers = ["X-From", "monitor"]
    timeout = "25s" # timeout for every url

    [[instances]]
    # Volume Server
    labels = { ident="volume", cluster="aaa", role="volume" }
    urls = [
        "http://machine1:19092/metrics",
        "http://machine2:19092/metrics",
        "http://machine3:19092/metrics",
        "http://machine4:19092/metrics",
        "http://machine5:19092/metrics",
        "http://machine6:19092/metrics",
    ]
    url_label_key = "instance"
    url_label_value = "{{.Host}}"
    headers = ["X-From", "monitor"]
    timeout = "25s" # timeout for every url

VictoriaMetrics组件启动参数

  • vmstorage
    vmstorage-prod -loggerTimezone Asia/Shanghai -storageDataPath /data5/victoria-metrics-data/ -dedup.minScrapeInterval=5s -retentionPeriod=400d -search.maxUniqueTimeseries=1000000 -vminsertAddr=:8400 -vmselectAddr=:8401 -httpListenAddr=:8482
  • vmselect
    vmselect-prod -storageNode=n1:8401,n2:8411,n3:8401,n4:8411 -dedup.minScrapeInterval=1ms -search.maxSeries=10000000 -search.maxUniqueTimeseries=1000000 vmstorageDialTimeout=15s
  • vminsert
    vminsert-prod -replicationFactor=2 -maxInsertRequestSize=9999999999 -vmstorageDialTimeout=15s -storageNode=n1:8400,n2:8410,n3:8400,n4:8410
3 Answers

有两个思路你可以参考:
1,查看Categraf、n9e、vm是否有报错日志,看看日志里是否有线索
2,把Categraf换成agent mode模式的 Prometheus,看看是否还有问题

第一点:categraf仅有的日志在下一楼,n9e、vm无异常日志
第二点:大概率是categraf的原因,因为之前一直使用telgraf采集,是正常的

categraf仅有的日志如下

2023/04/07 17:54:54 prometheus.go:231: E! failed to parse response body, url: http://machine3:8030/metrics error: reading text format failed: text format parsing error in line 404: second TYPE line for metric name "doris_fe_query_latency_ms", or TYPE reported after samples
2023/04/07 17:54:54 prometheus.go:231: E! failed to parse response body, url: http://machine1:8030/metrics error: reading text format failed: text format parsing error in line 406: second TYPE line for metric name "doris_fe_query_latency_ms", or TYPE reported after samples
2023/04/07 17:54:54 prometheus.go:231: E! failed to parse response body, url: http://machine6:8031/metrics error: reading text format failed: text format parsing error in line 401: second TYPE line for metric name "doris_fe_query_latency_ms", or TYPE reported after samples
2023/04/07 17:54:54 prometheus.go:231: E! failed to parse response body, url: http://machine5:8031/metrics error: reading text format failed: text format parsing error in line 378: second TYPE line for metric name "doris_fe_query_latency_ms", or TYPE reported after samples
2023/04/07 17:54:54 prometheus.go:231: E! failed to parse response body, url: http://machine4:8031/metrics error: reading text format failed: text format parsing error in line 507: second TYPE line for metric name "doris_fe_query_latency_ms", or TYPE reported after samples
2023/04/07 17:54:54 prometheus.go:231: E! failed to parse response body, url: http://machine2:8030/metrics error: reading text format failed: text format parsing error in line 496: second TYPE line for metric name "doris_fe_query_latency_ms", or TYPE reported after samples

更新:最终还是切换到 Pormetheus 原生抓取,第三方agent的兼容性终究不如原生~

看了下代码,这个报错好像是来自prometheus sdk里面的,大概意思就是同一个metrics name出现了两个TYPE,类似下面这种情况?大佬指导下@ulricqin

# HELP my_metric This is my metric
# TYPE my_metric counter
my_metric{label="value"} 42
# TYPE my_metric gauge

代码部分

// prometheus/common@v0.39.0/expfmt/text_parse.go
// readingType represents the state where the last byte read (now in
// p.currentByte) is the first byte of the type hint after 'HELP'.
func (p *TextParser) readingType() stateFn {
	if p.currentMF.Type != nil {
		p.parseError(fmt.Sprintf("second TYPE line for metric name %q, or TYPE reported after samples", p.currentMF.GetName()))
		return nil
	}
	// Rest of line is the type.
	if p.readTokenUntilNewline(false); p.err != nil {
		return nil // Unexpected end of input.
	}
	metricType, ok := dto.MetricType_value[strings.ToUpper(p.currentToken.String())]
	if !ok {
		p.parseError(fmt.Sprintf("unknown metric type %q", p.currentToken.String()))
		return nil
	}
	p.currentMF.Type = dto.MetricType(metricType).Enum()
	return p.startOfLine
}