
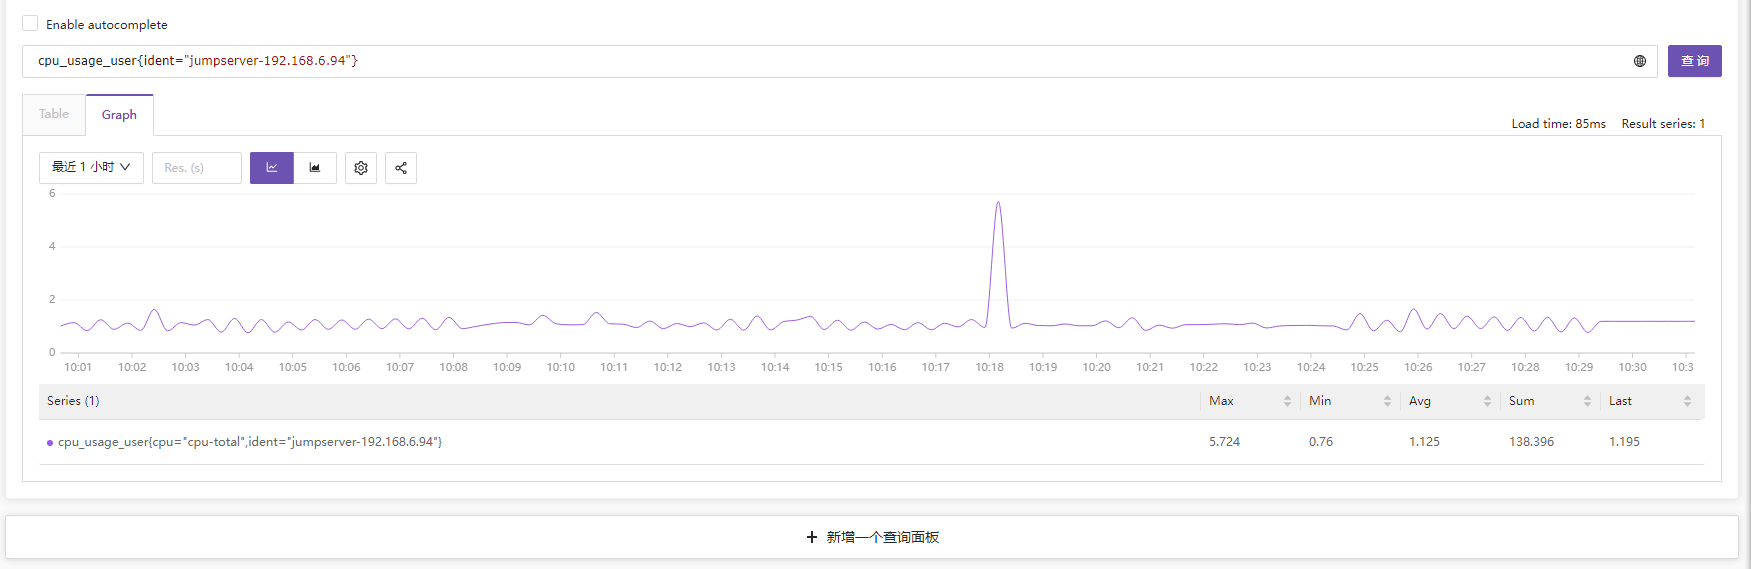
同时发现“即时查询”界面,查询这个主机,table没有数值,但是graph里面有图形。

版本信息:
前端版本:5.15.0
后端版本:v5.15.0-87899cbedbc7bfcfff61052ebeed945a57a418d2
categraf:v0.2.29-591c6d13a65dd524d5cff3ea3b26cf32df33f1e7
对象列表里面CPU,内存,磁盘数据全部为0
Viewed 68
2 Answers
用的Prometheus?发一下Prometheus的启动命令。如果用的 VictoriaMetrics,就发一下 vmselect 的启动命令。
另外,你在即时查询里执行下面这个promql:
cpu_usage_idle{ident="jumpserver-192.168.6.94"}[10m]
看看最新的那个值对应的时间戳,和当下时间差多少

使用的是prometheus,启动命令:
ExecStart=/data/prometheus/prometheus --config.file=/data/prometheus/prometheus.yml --storage.tsdb.path=/data/prometheus/data --web.enable-lifecycle --enable-feature=remote-write-receiver --quer
y.lookback-delta=2m
下面时prom的查询

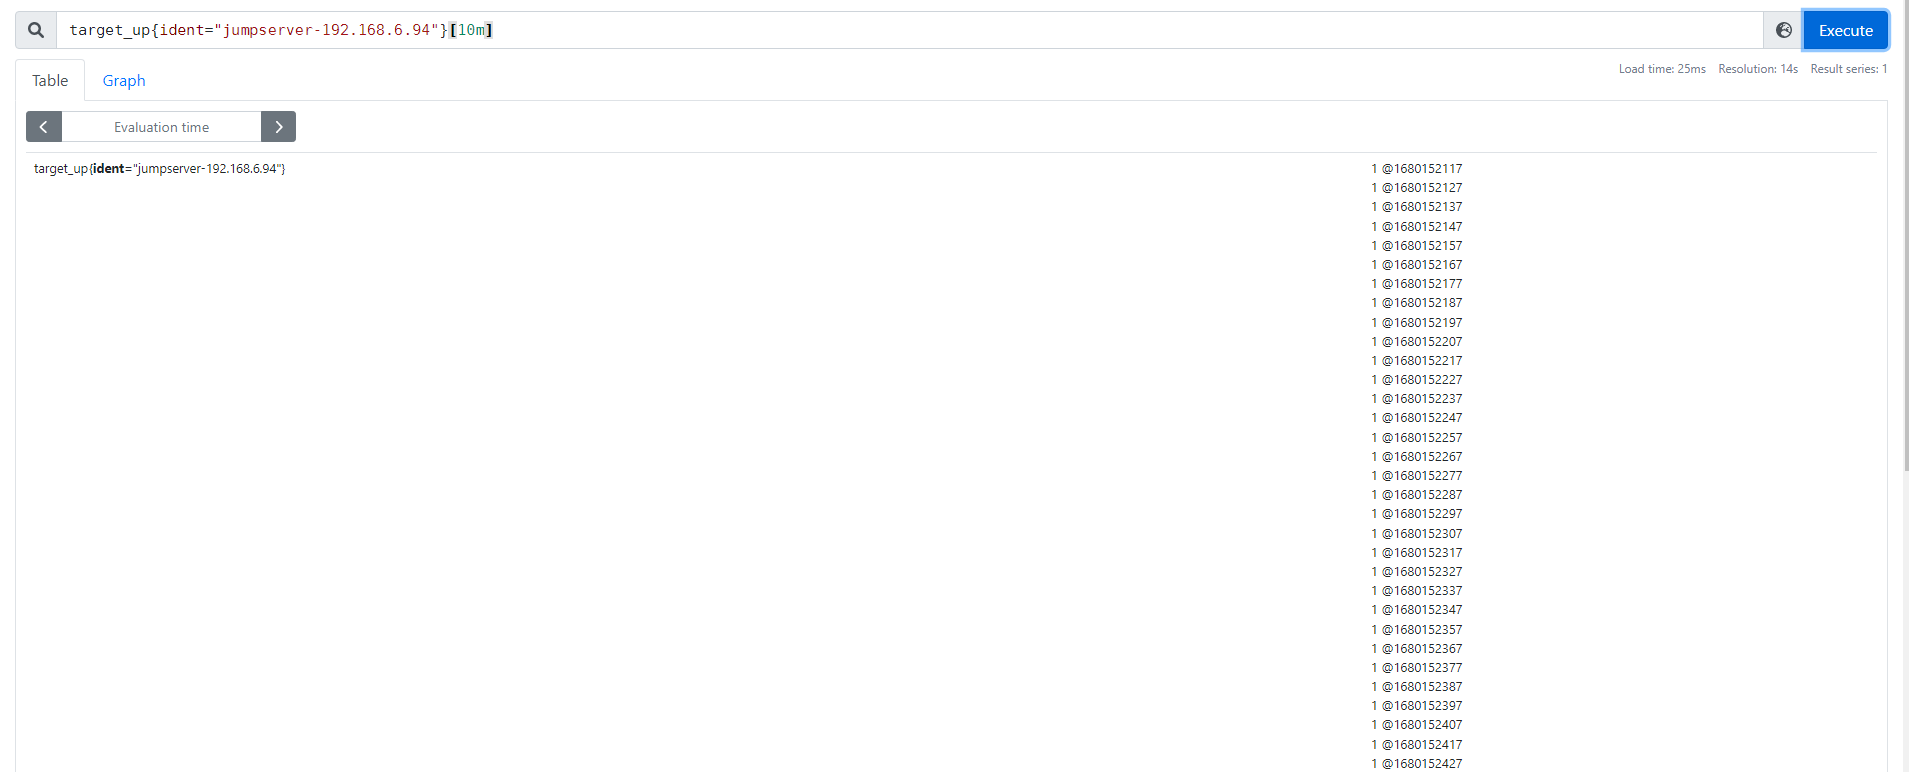
最新的那个时间戳和你pc的时间戳差多少?可以打开浏览器开发者工具看看http request 的参数,里边带了时间戳,哪个时间戳就是你的pc的时间戳。我怀疑你的服务器的时间相比你的pc的时间滞后了
好的,谢谢解决了,就是服务器时间滞后了。